
Proprietary data gave us a head start, feeding a model built to turn early returns into a sharper national forecast.
All times in this piece are Eastern.
The moment we knew
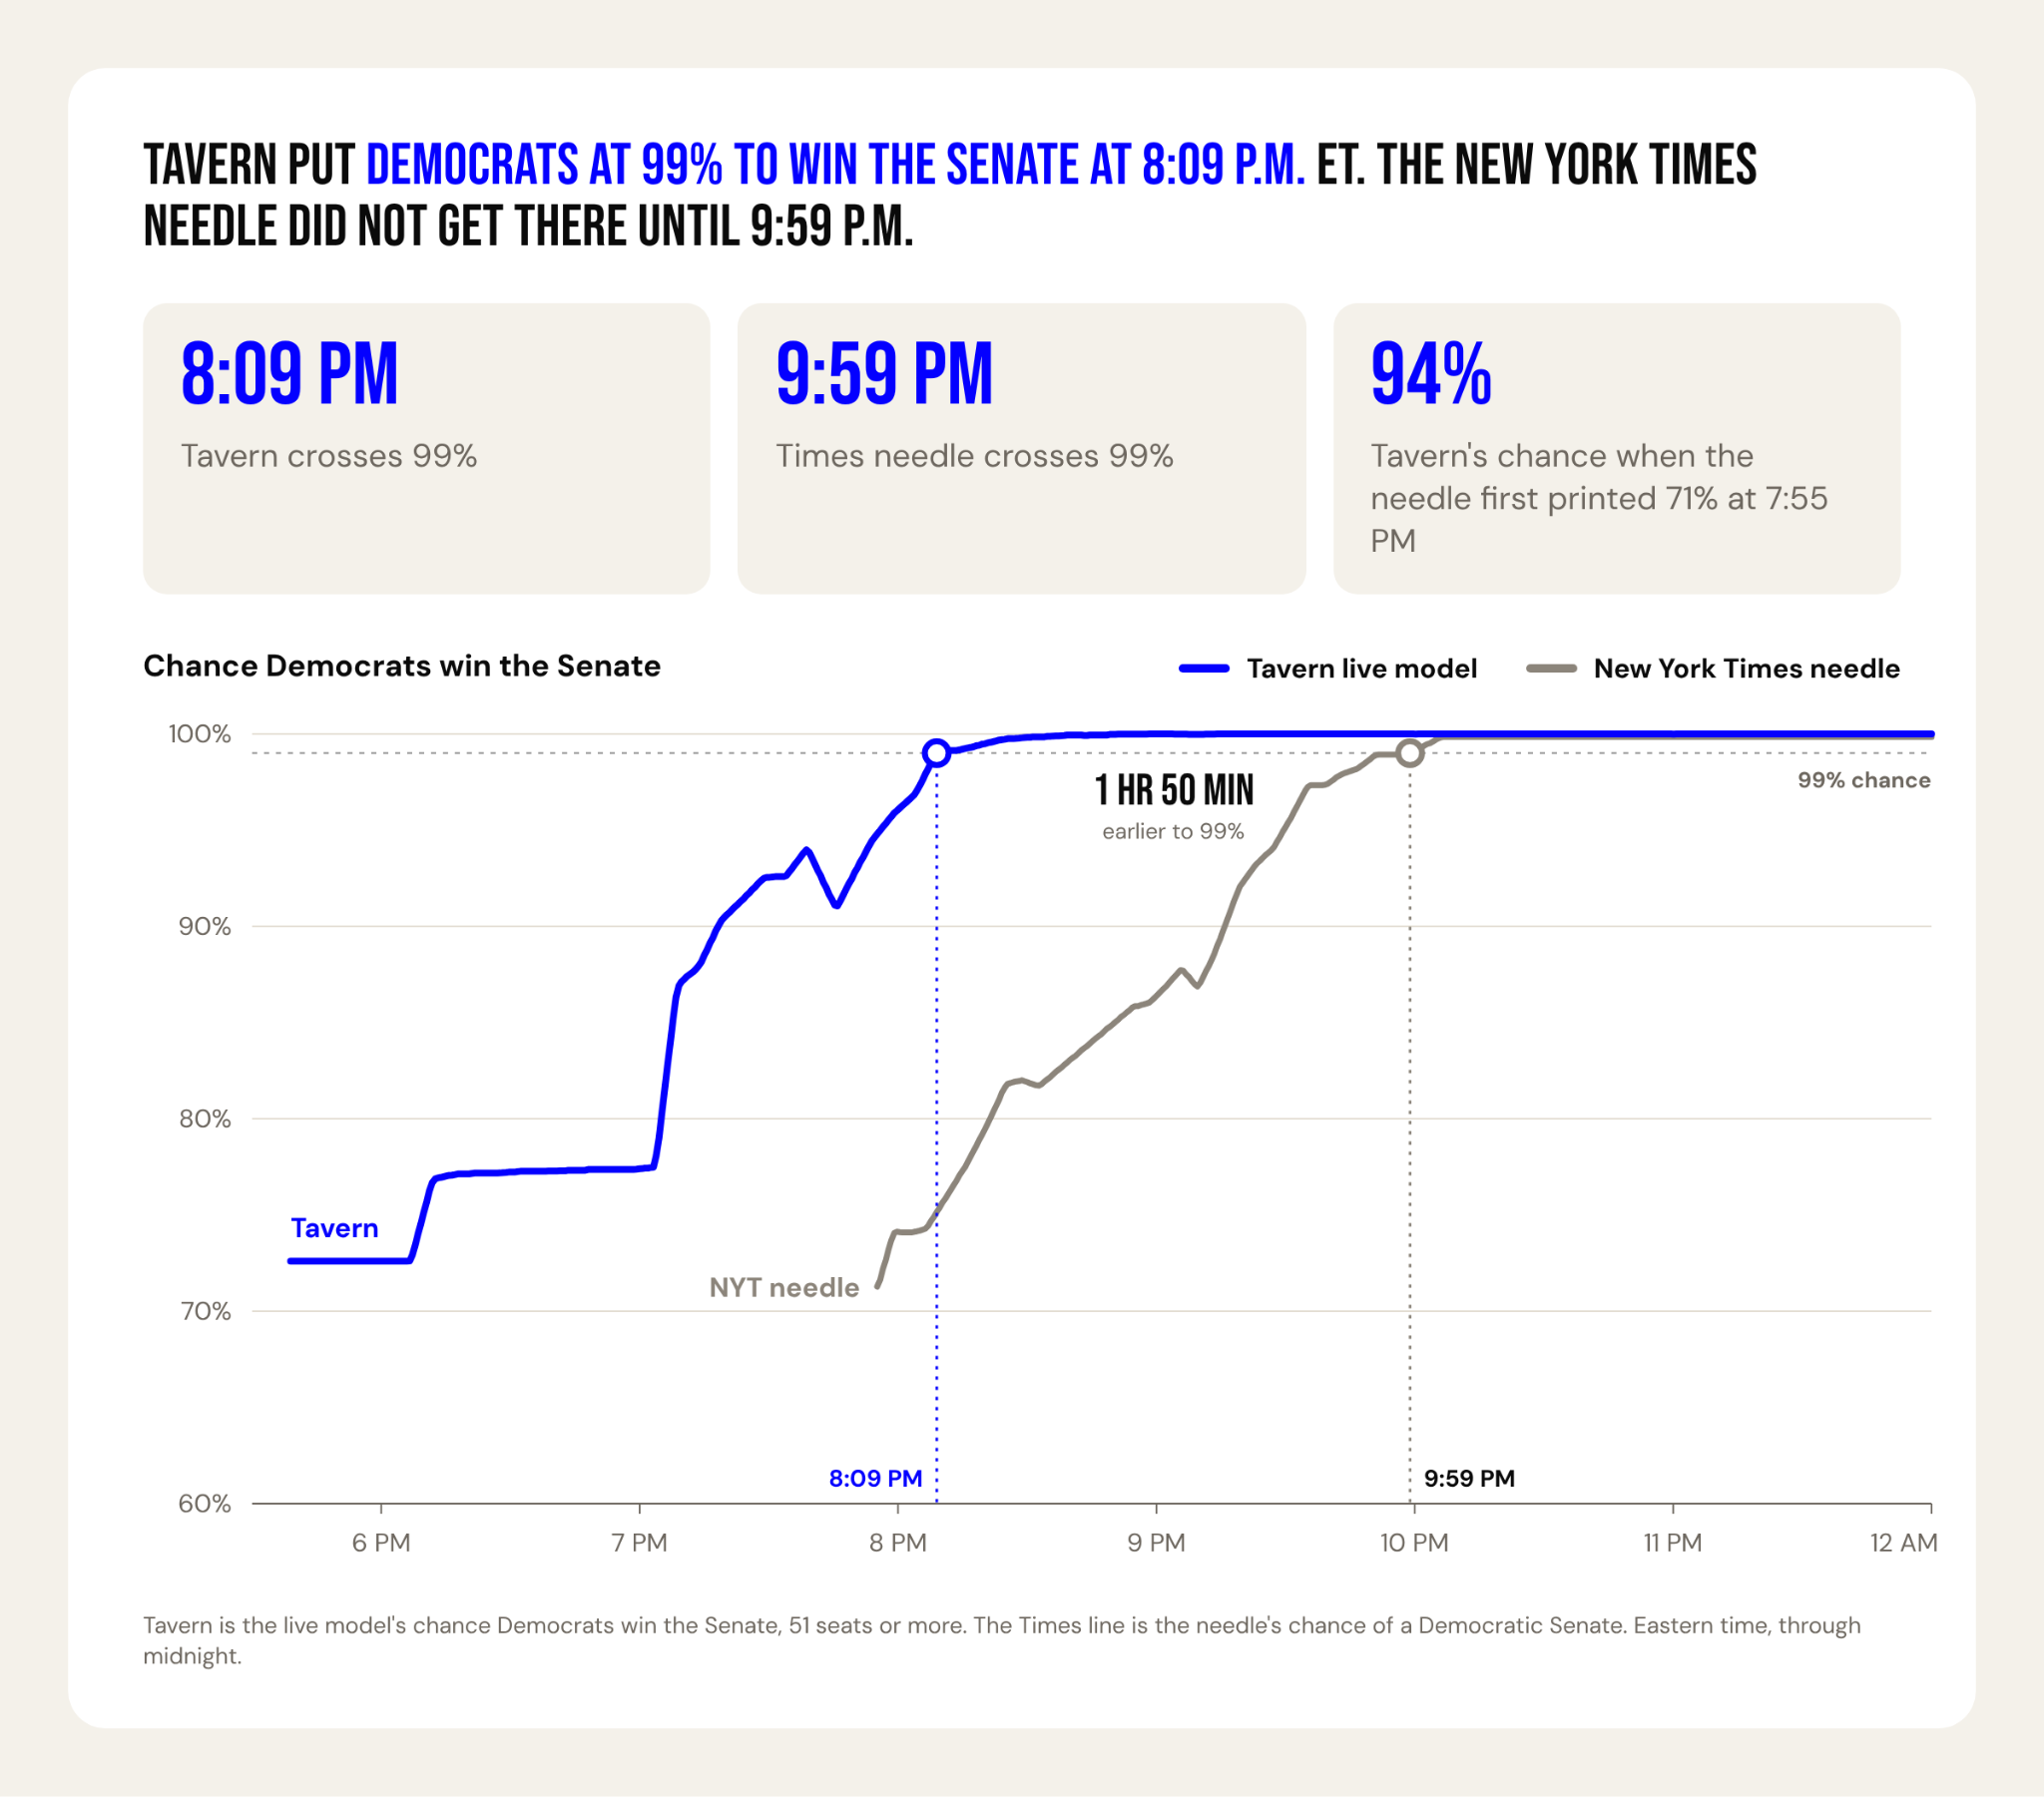
At 8:10 PM on election night, Democrats had reason to hope. NBC’s Steve Kornacki moved county by county through the initial returns from Texas’s Senate race, pointing out where James Talarico was beating Beto O’Rourke’s margins. If those trends held, he noted, it would be a “major development” for Democrats. The New York Times had unveiled its 2026 Senate control Needle just minutes earlier, and its probability for Democrats had inched up from 71% to 74%. Polls in the key Senate races of Texas and Kansas had only just closed, yet the broader mood among Democrats online was cautious optimism.
But Tavern had already seen enough: by 8:10pm, our forecast model gave Democrats a 99% chance of capturing the Senate.
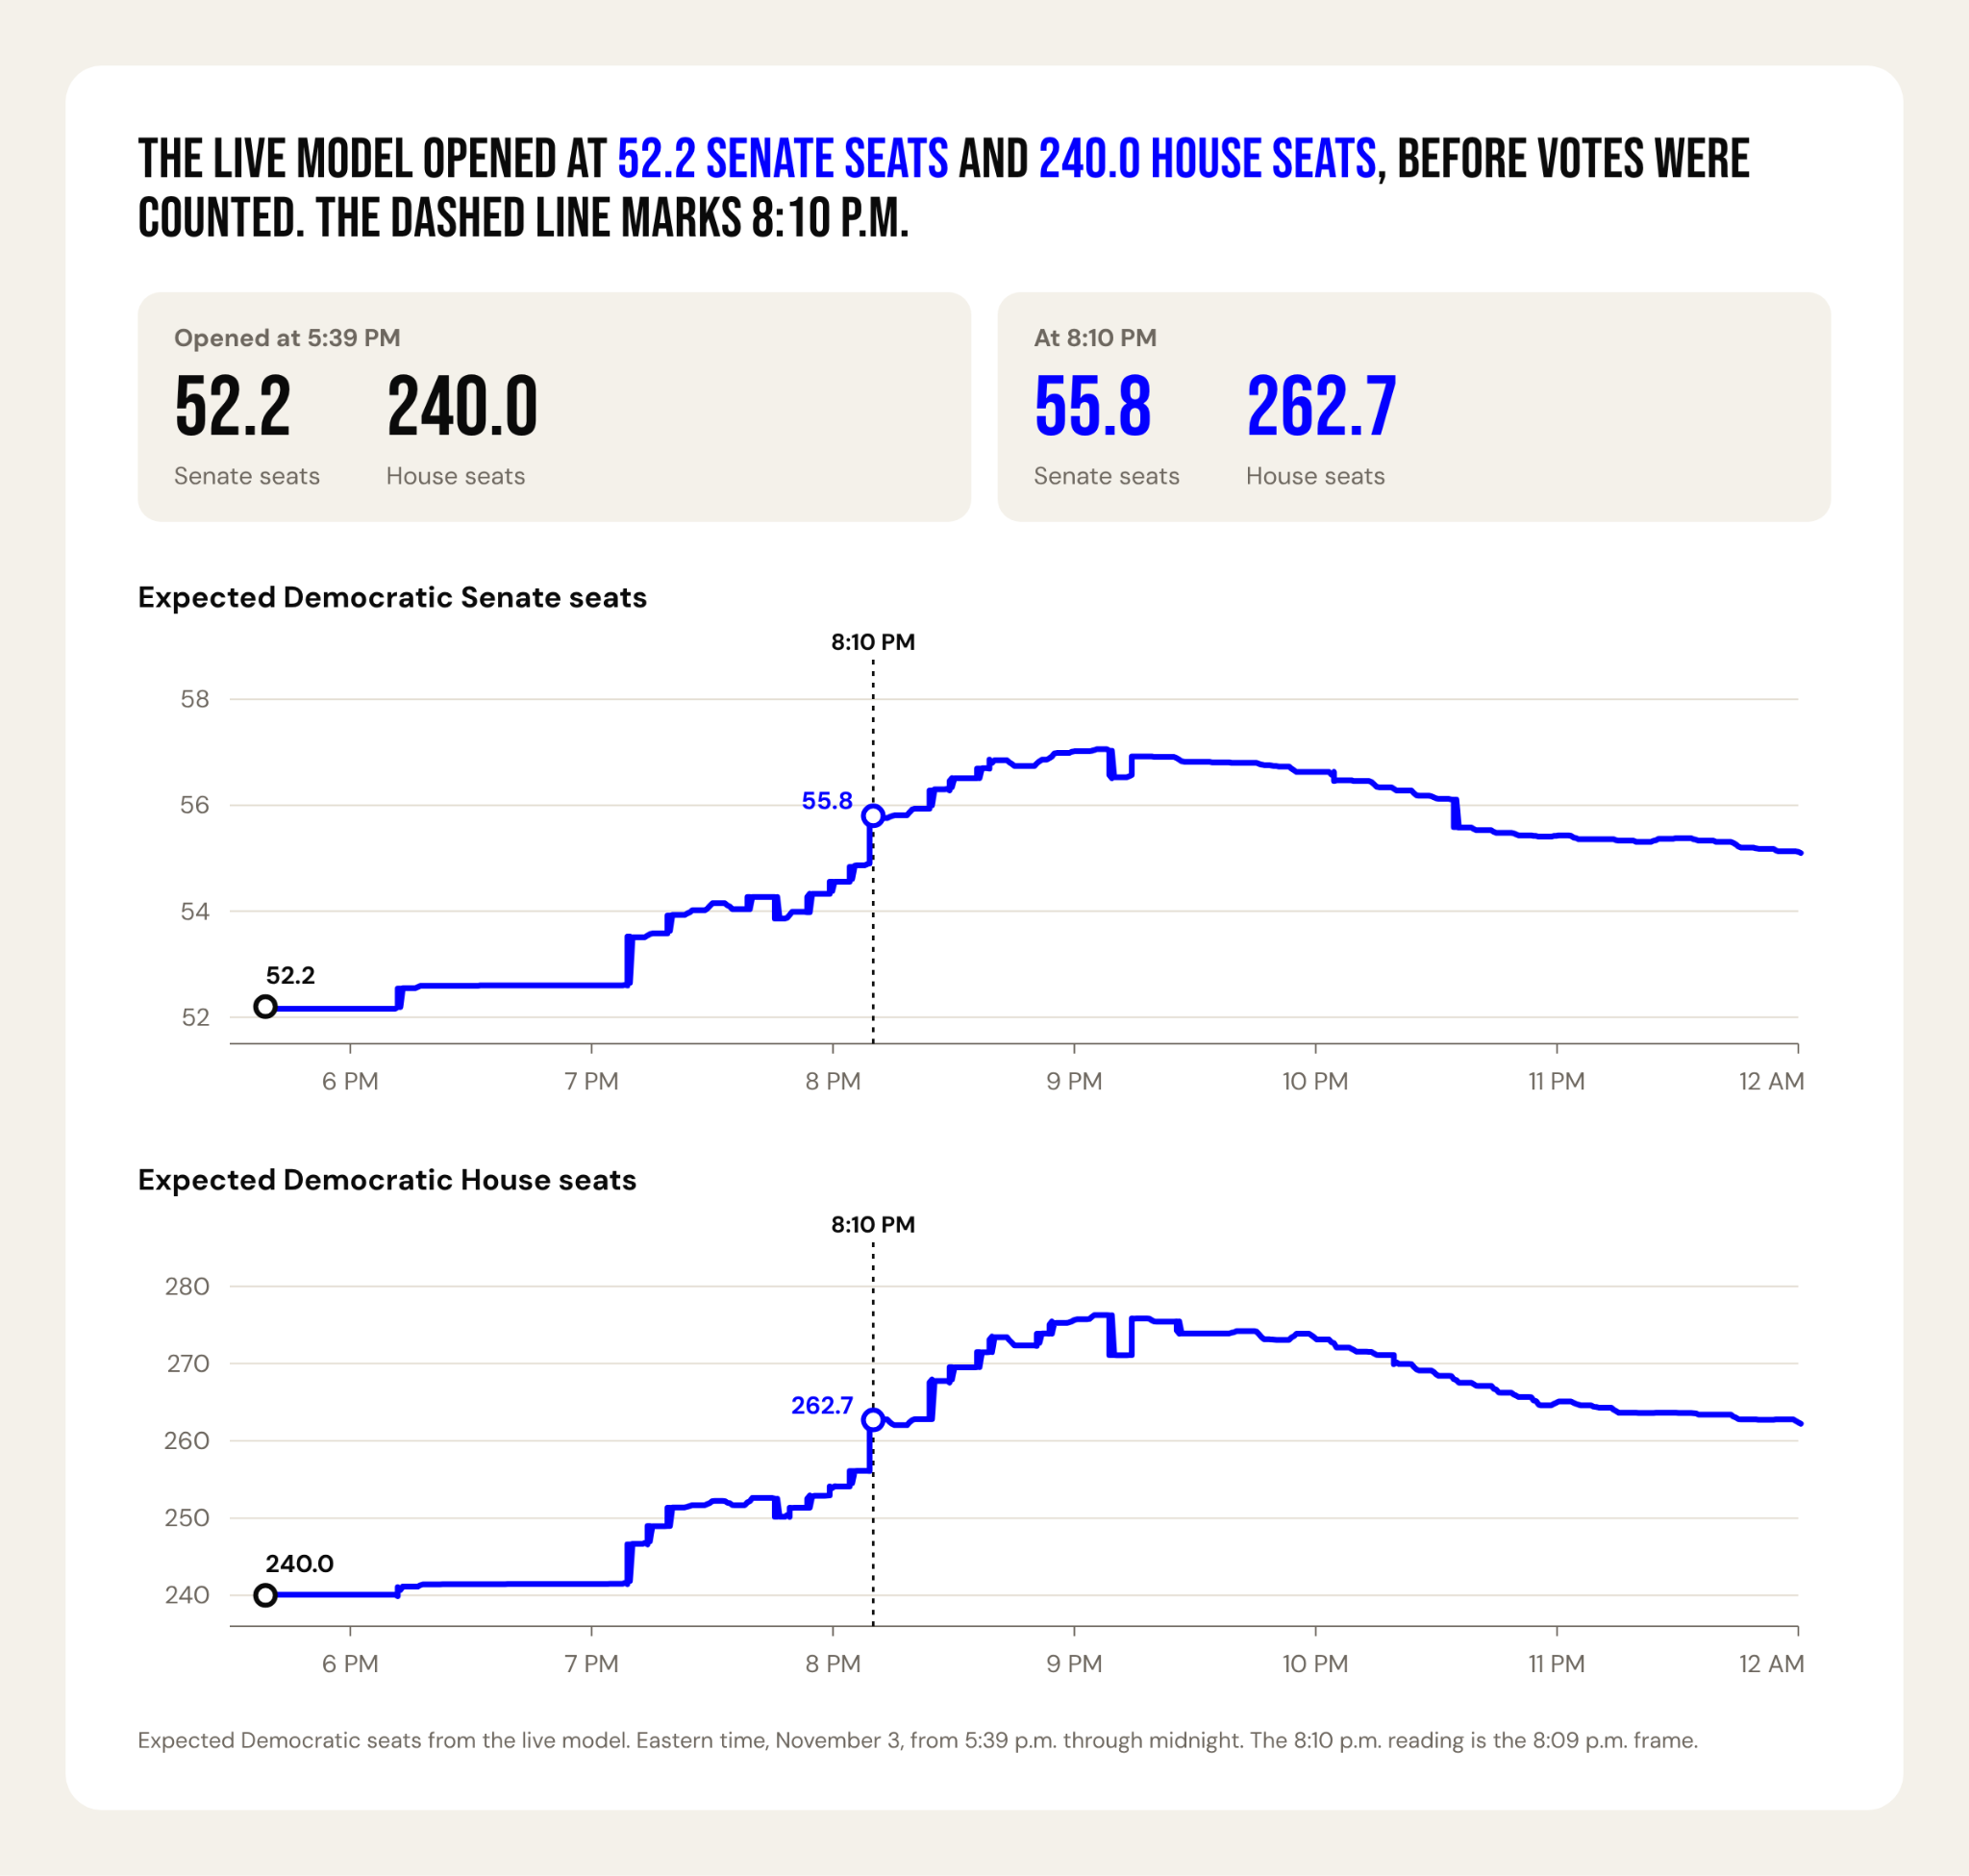
It wasn’t just Democrats’ Senate chances: Tavern called the size of the wave, too. At 8:10 PM, we forecast roughly 56 Democratic Senate seats and 263 Democratic House seats.
This is what working with Tavern can offer: a clearer signal sooner, giving you more time to prepare and act.
We weren’t working from better returns data. Major outlets had much of the same partial returns, plus larger teams covering them. The New York Times Needle, in particular, has a track record of catching trends in previous election cycles. These were strong models run by experienced teams.
So, how did Tavern spot the wave so confidently before mainstream outlets?
Tavern’s proprietary polling gave the model a head start
In the months leading up to the election, we conducted a significant volume of internal polling across key battleground Senate and House races, and various “reach” states. Since Labor Day alone, we ran over 50 polls across key Senate battlegrounds. That gave our model a meaningful data advantage over our peers, especially in the least-polled states.
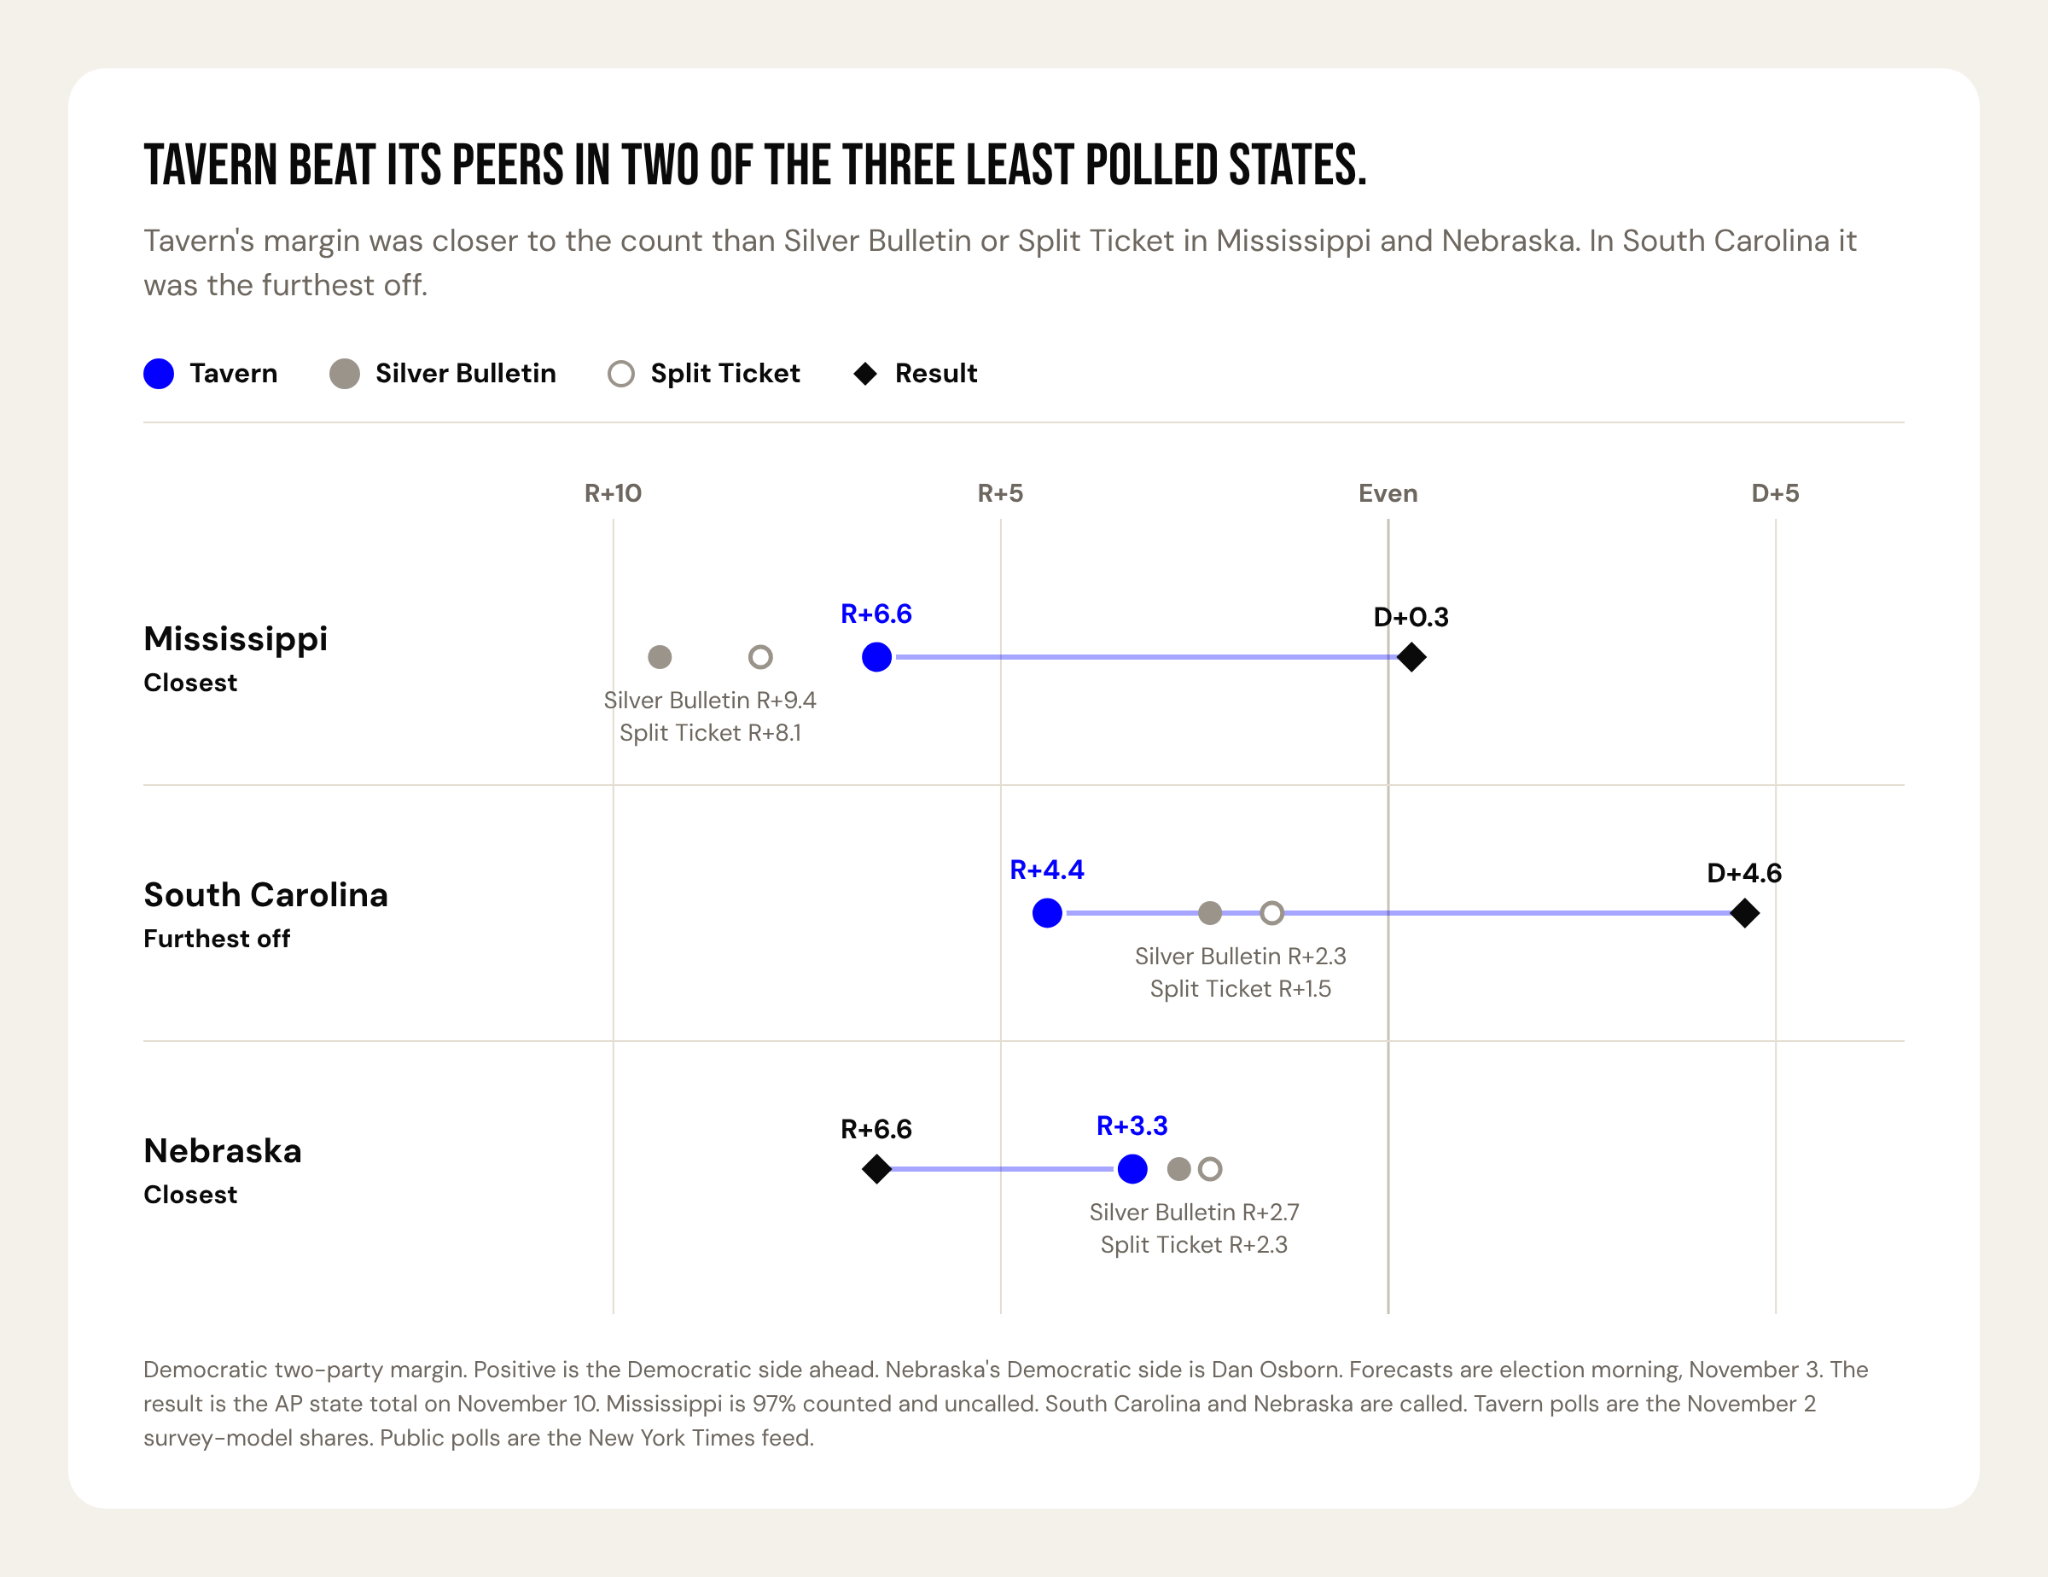
However, a better starting point alone wasn’t enough to detect a trend, especially on a night when Democrats outperformed our pre-election national forecast by about four points on the margin and when everyone’s starting estimates were off. We had to recognize the shift as returns came in and update accordingly. That’s where our election night model enters the picture.
Tavern built the election night model to detect a wave early
Before the election, we distributed a watch guide with a specific claim: if Democrats won IN-05 and KY-06, the two competitive House districts in the earliest poll-closing window, they would be on track for a very large wave. Our forecast in that scenario: a 97.5% chance of Senate control, 55 expected Senate seats, and 257 expected House seats.
That claim came from our pre-election simulations, where we saw that when Democrats won both districts, they almost always went on to have a strong night nationally. This Bayesian logic was built into our model: early results could tell us how much to revise expectations for races elsewhere, even before those states started reporting.
By 7:30 PM, with only 5% of House returns in nationally, our model had already detected a shift. The national environment looked like D+111 or stronger, rather than the roughly D+9 our pre-election forecast had suggested. For comparison, our count currently stands at approximately D+13.
IN-05 helped drive that update. With roughly half its votes counted, our forecast for the district had moved from a four-point Democratic deficit before the night began to a nearly two-point Democratic lead. KY-06 contributed too, though to a lesser extent: with under 10% of its vote counted, our forecast there had moved from a two-point Democratic deficit to an even race.
The early seats we’d identified as potential wave signals were moving the way we’d expected in a wave scenario, and most other districts with partial returns were pointing the same way. Our Senate forecast moved in favor of Democrats accordingly.
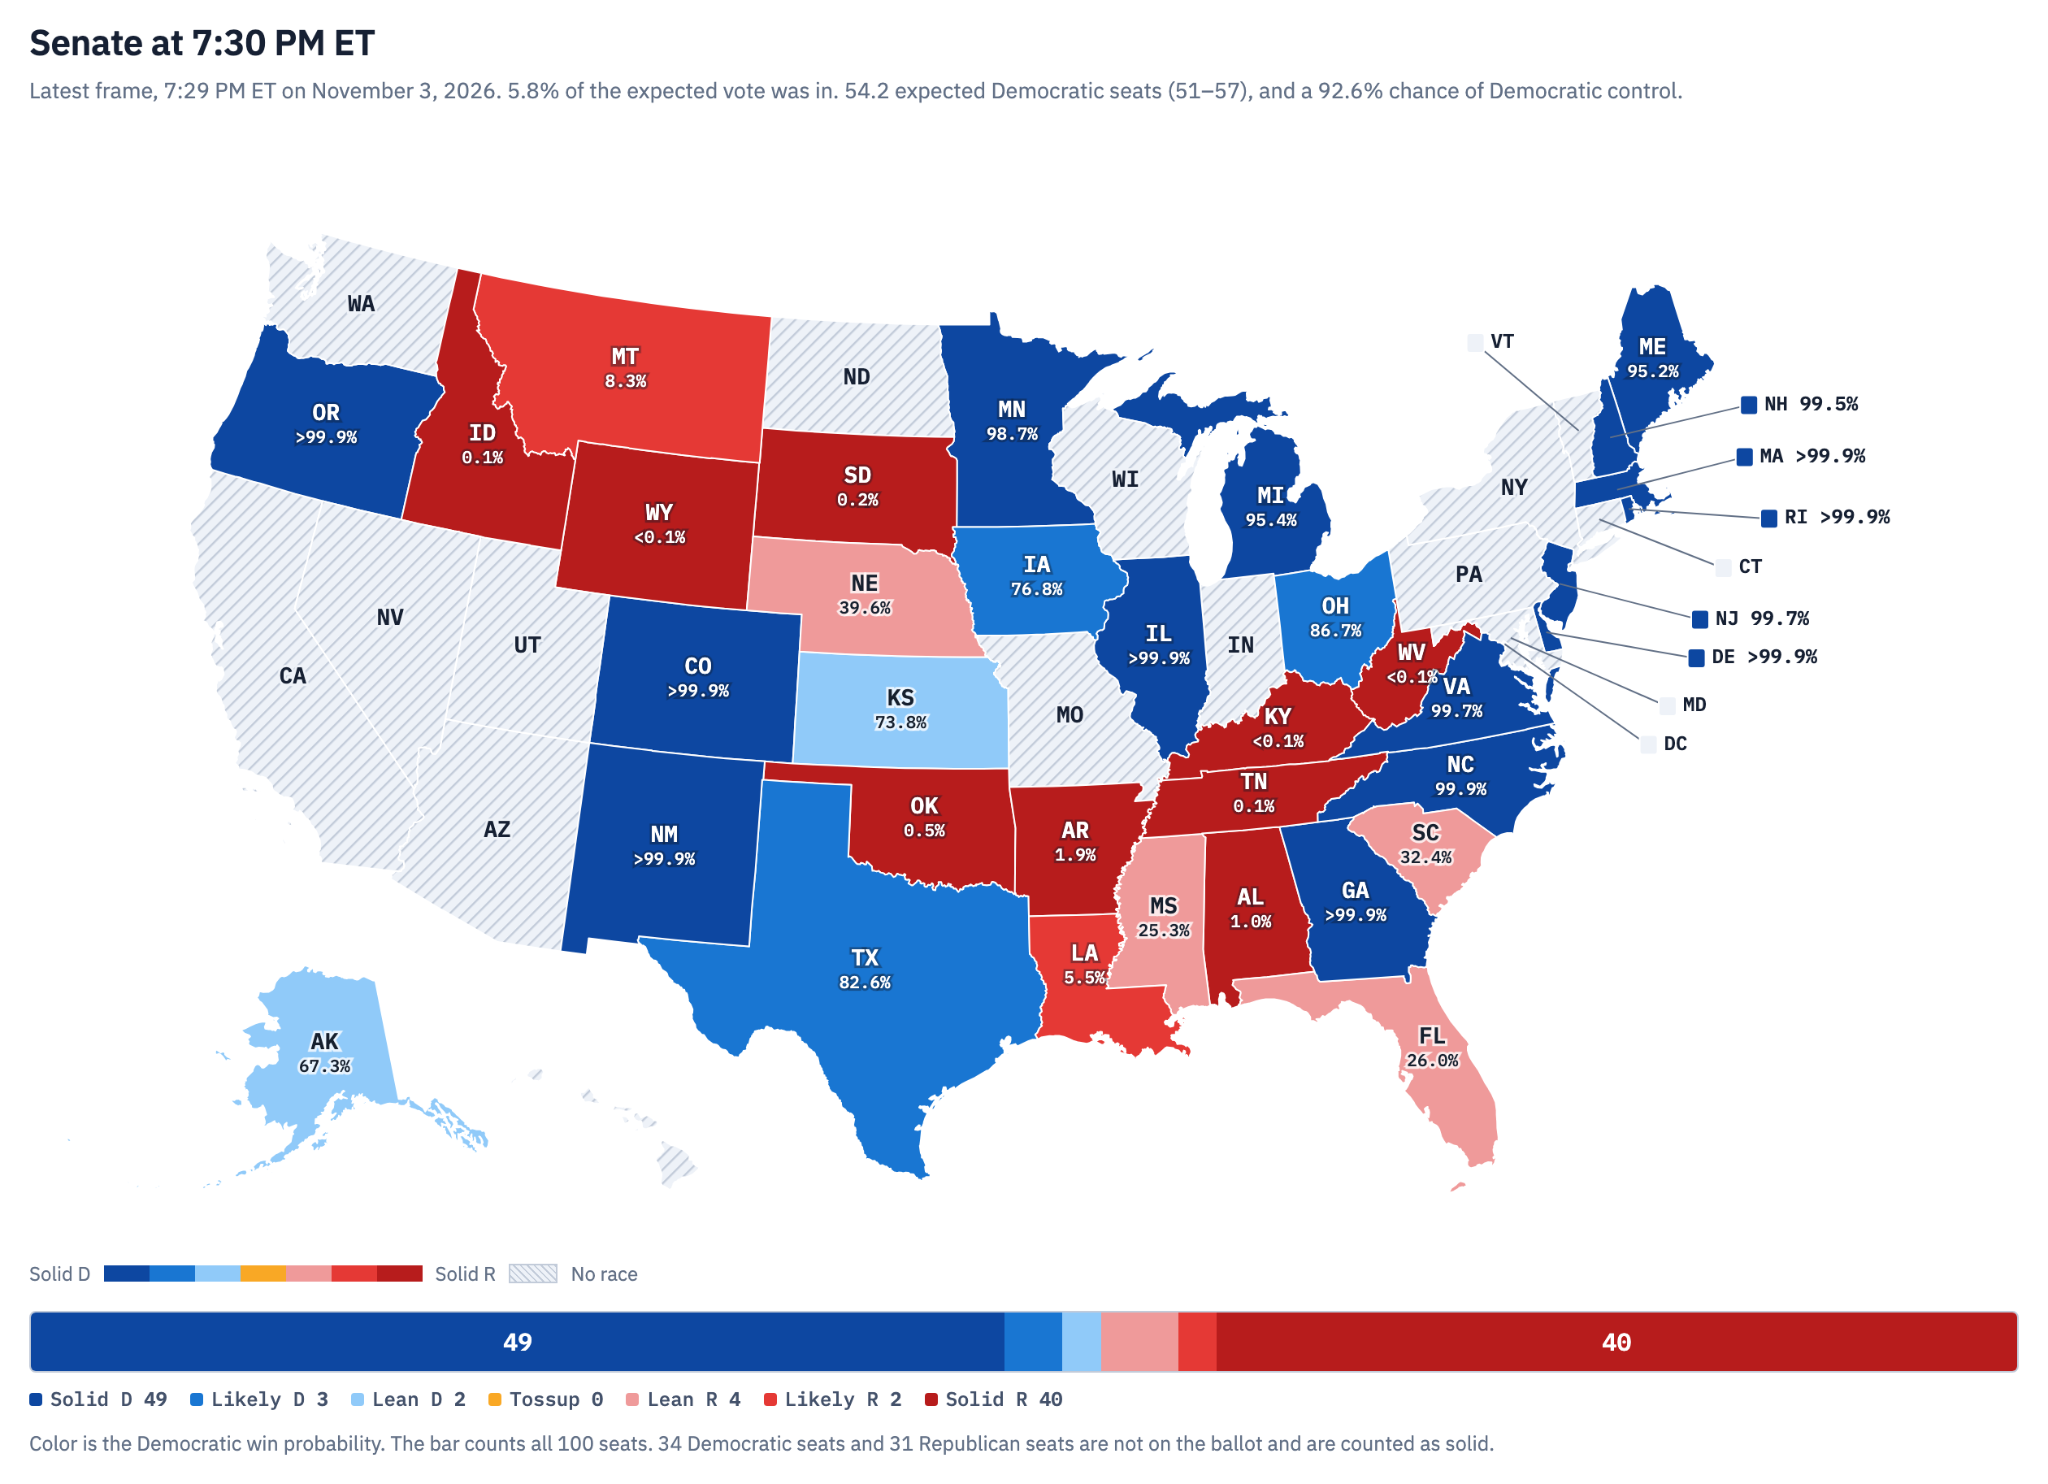
By 8:10 PM, with about 12% of ballots counted nationally, Democrats continued to outperform our pre-election forecast. Our model grew more confident, and its estimate of the national environment climbed to D+14. Again, our forecast reflected that shift, and gave Republicans under a 1% chance of controlling the Senate.
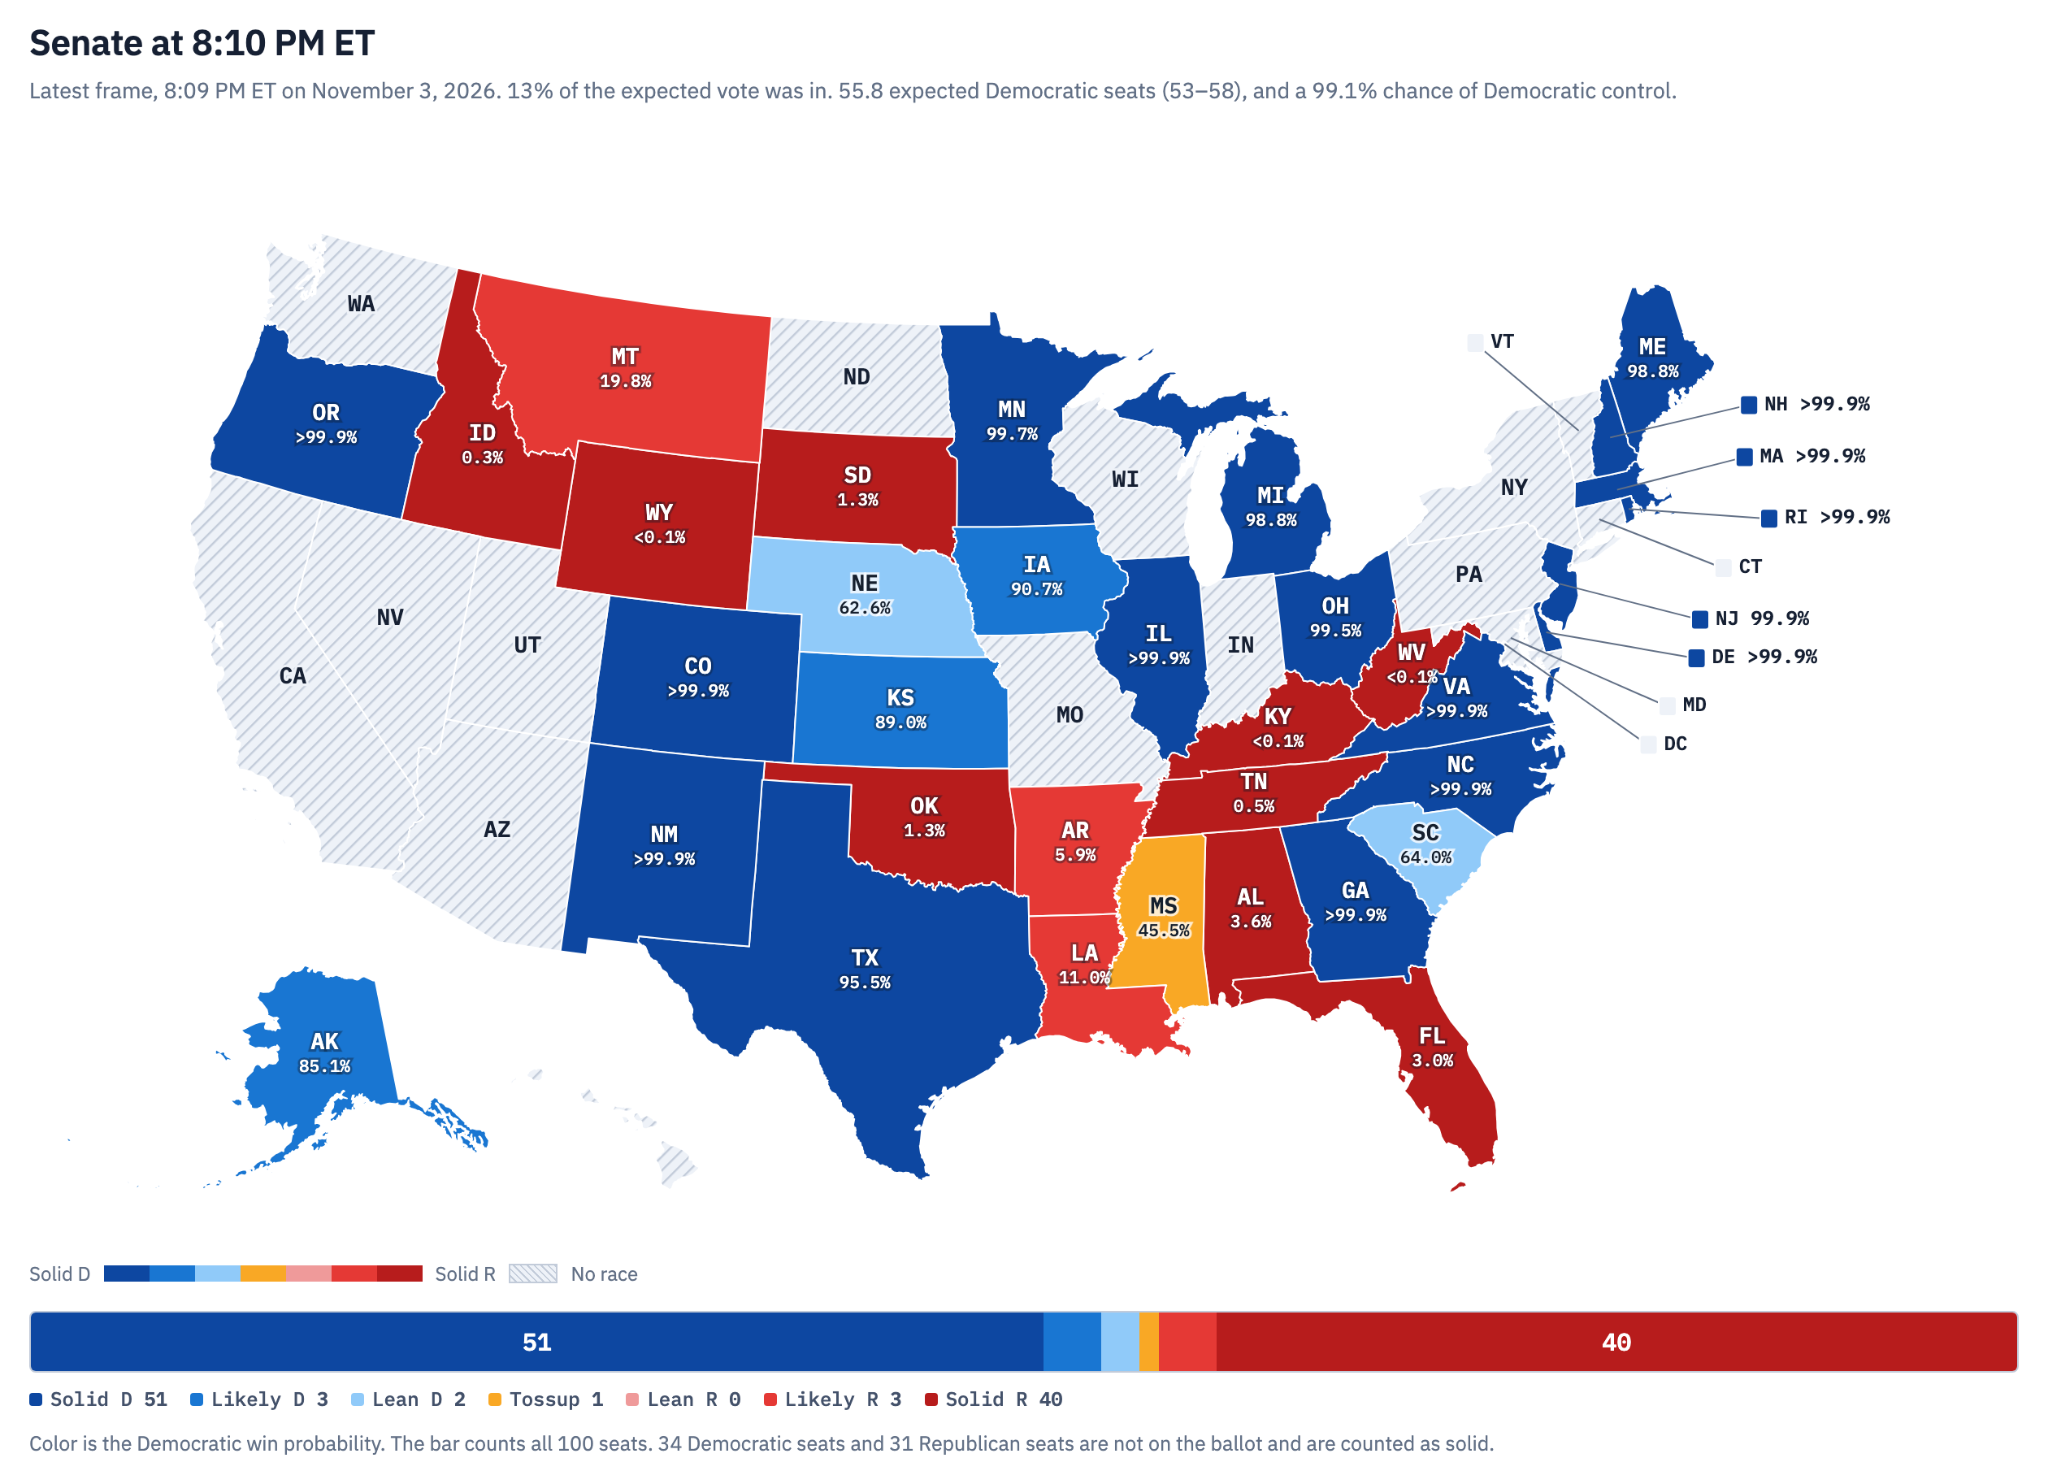
Meanwhile, the New York Times Needle had only meaningfully updated for races with counting significantly underway. Their map looked very different from ours.
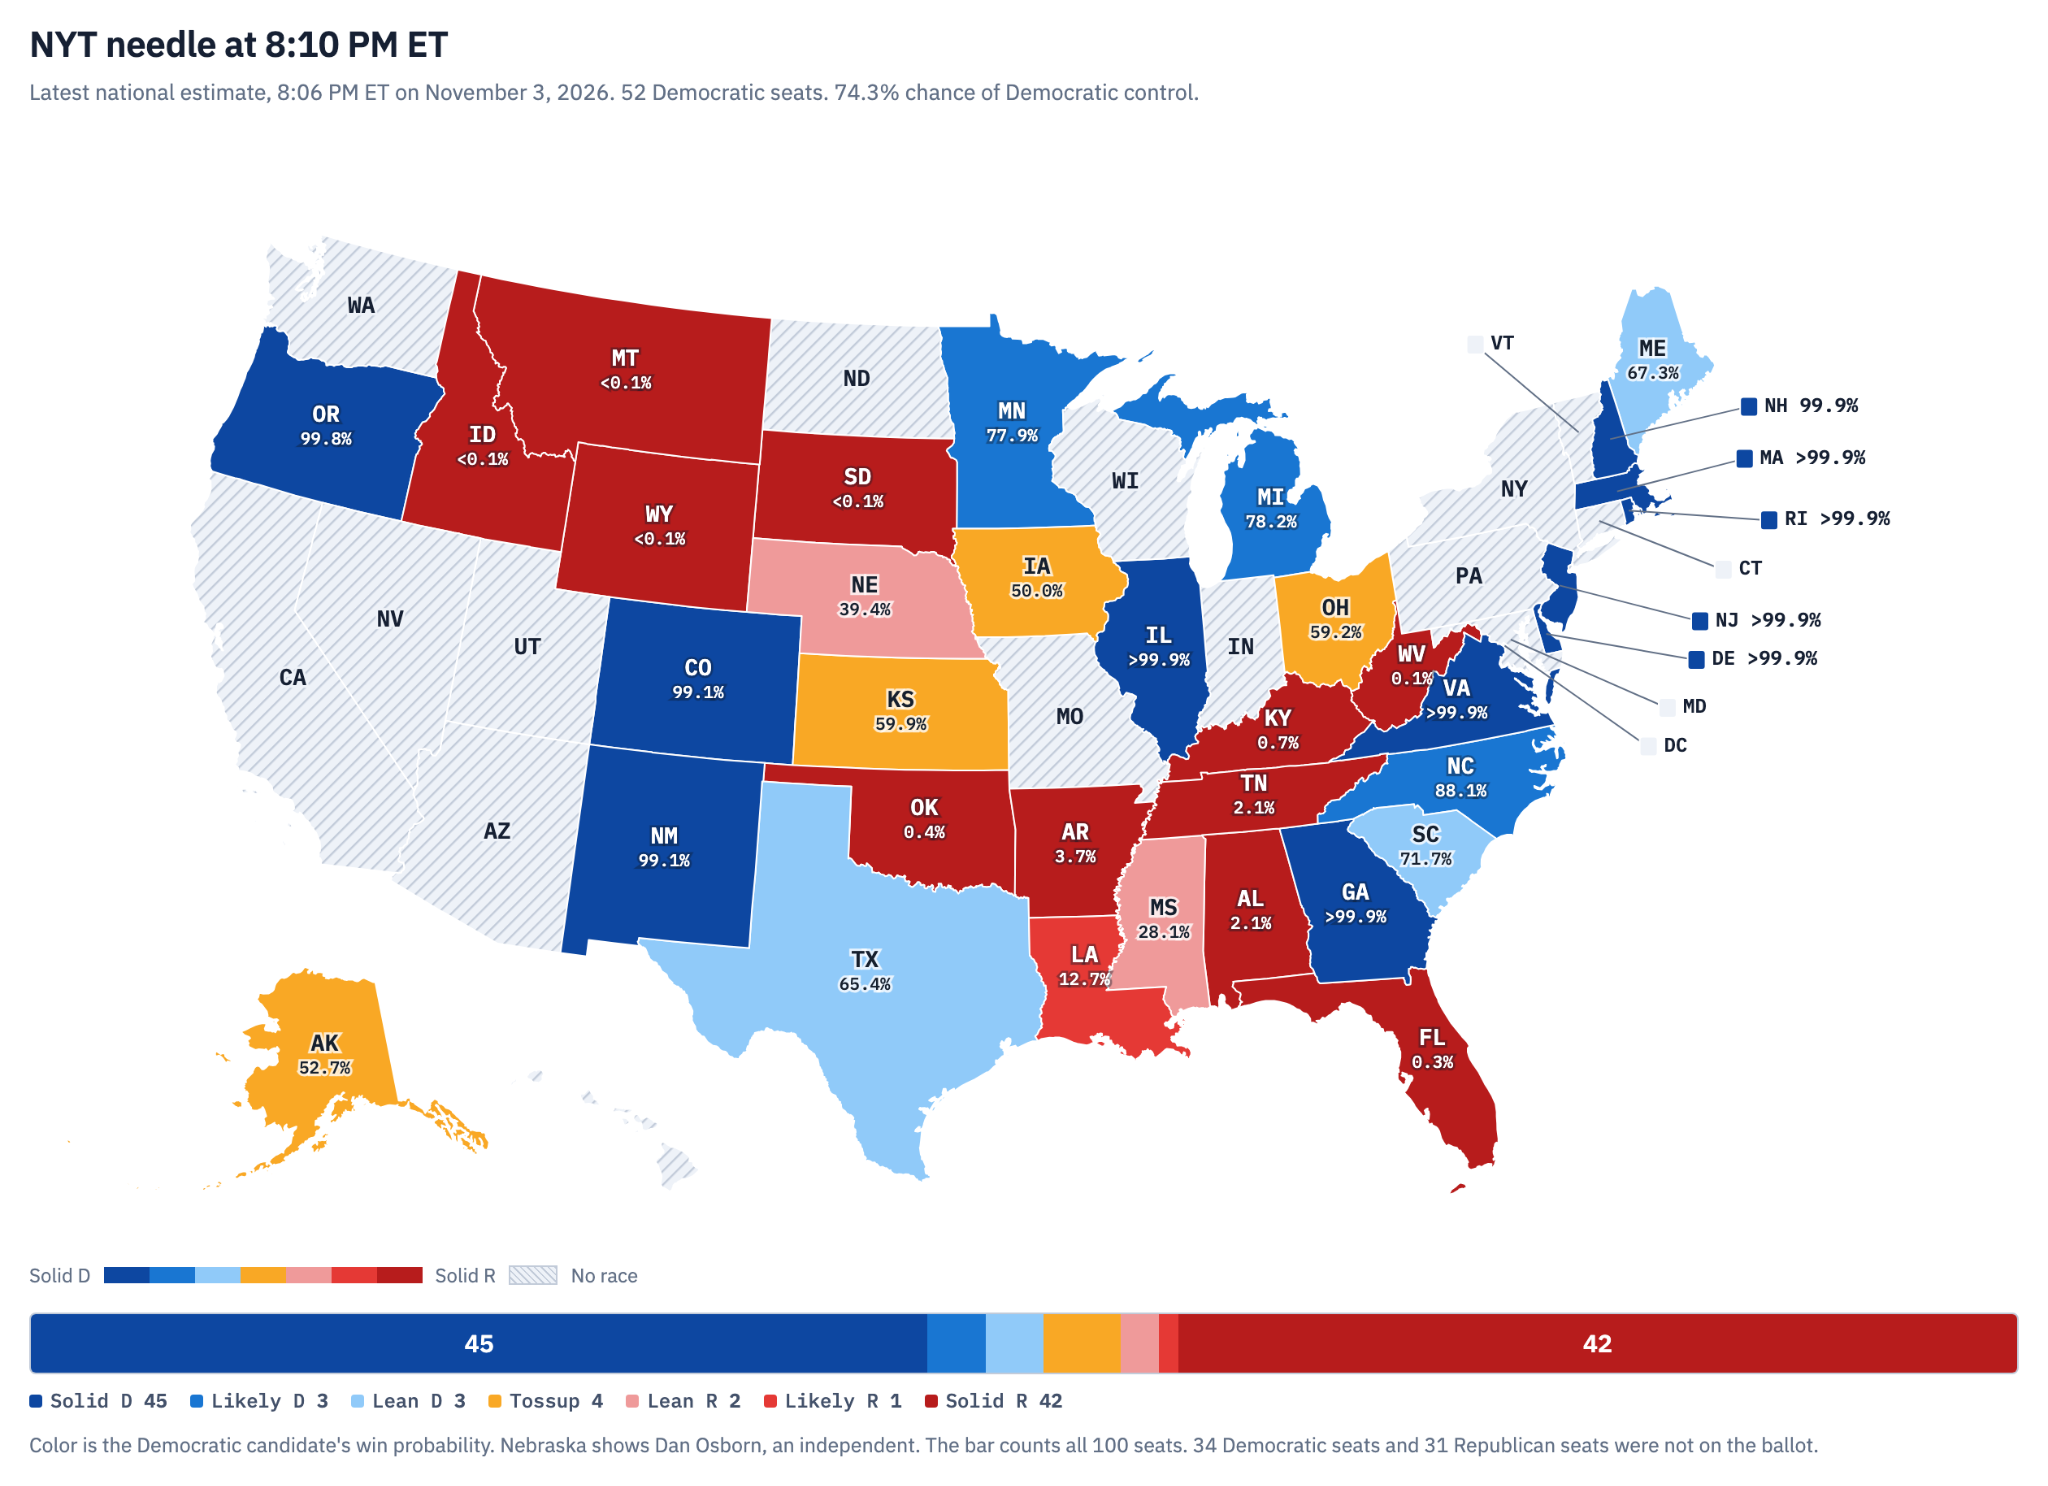
Even as we saw a blue tsunami clearly smashing into the country’s eastern states, the question remained: how blue, exactly, would the country end up?
What held up, and what we’re improving
The national margin currently stands at roughly D+13, close to our D+14 estimate at 8:10 PM. Democrats are also on track to hold 56 Senate seats and about 260 House seats, nearly matching our 8:10 PM forecast of 56 and 263. But our forecast didn’t stay there.
While we were faster than most mainstream outlets at spotting the wave, our model probably updated too aggressively. At 9:30 PM, we projected roughly D+16 and more than 270 Democratic House seats. That national estimate was nearly as far from the current margin as our pre-election D+9 forecast.
There was a reason for the overshoot: with about a third of votes counted, the earliest-counting states were disproportionately places where Democrats overperformed. Our model gave that pattern too much weight when estimating the remaining two-thirds of the vote. Calibrating how strongly early results should update expectations elsewhere is a specific improvement we can make for the next cycle.
We also weren’t alone in spotting the wave early. Kalshi’s prediction markets moved at a similar pace early on and outperformed our model at points later in the evening. That trading data may contain useful signals about unexpected trends that human traders were picking up. We’ll explore whether incorporating this data can improve our forecasts.
Late returns are another area to improve. Here, the New York Times and other mainstream outlets had the edge. Their larger teams let them monitor returns at a more granular level and adjust their estimates more precisely than our model as votes came in.
That advantage mattered in close races with most ballots already counted, as their teams had a more precise read on what each new batch of votes meant for the remaining count. In Mississippi, this helped the Needle catch late trends faster than our model. We can improve how our model accounts for those returns and work to close that gap.
As we incorporate the full results from this election and continue running surveys next year, we’ll use what we learn to sharpen the model for the next cycle: correctly catching broad shifts early, while improving precision late.
Earlier signal. More time to act.
Election night showed what Tavern does best: proprietary research gave us a stronger starting point, and a model built to learn helped us recognize a major shift before it became conventional wisdom.
For clients following Tavern, that advantage was concrete. At 8:10 PM, our model gave Democrats a 99% chance of Senate control while the New York Times Needle was still at 74%. We didn’t get every move right. But our clients had an earlier understanding of where the night was heading.
That’s the opportunity we’re building toward: a repeatable system for turning original research into a decision-making advantage. We generate our own data, build models that make it useful, and use new evidence to sharpen our read. For customers, that means more time to prepare, prioritize, and act as conditions change.
Election night put that system to the test in public, minute by minute. It showed what worked and where we need to improve. The value of getting faster and more accurate is straightforward: our clients can make better-informed decisions while others are still working out what’s happening.
1 D+N means Democrats lead by N percentage points in the national House popular vote, adjusted for uncontested races. D+11, for example, means Democrats winning the national House vote by 11 points, or roughly 55.5% to 44.5% between the two parties. In districts where only one major party fielded a candidate, we replace the actual result with a modeled estimate of how the district would have voted with both parties on the ballot, similar to Split Ticket’s SHAVE method. Current figures reflect votes counted as of November 12.
